PID Controller
2 Controller Structure (Illustration Possibilities)
3 PID Controller: Power-plant Controller (Implementation 1 – I1)
4 Universal and Percent Controller (Implementation 2 and 3 – I2 and I3)
1 What is a PID controller?
A proportional integral derivative controller (PID controller) is a control loop feedback mechanism (controller) commonly used in industrial control systems. A PID controller continuously calculates an error value as the difference between a measured process variable and a desired setpoint. The controller attempts to minimize the error over time by adjustment of a control variable, such as the position of a control valve, a damper, or the power supplied to a heating element.
(Wikipedia EN: PID controller)
2 Controller Structure (Illustration Possibilities)
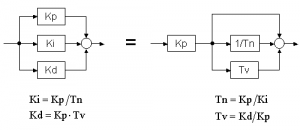
There are two possibilities to illustrate the controller structure, which are substantially identic. In analog measurement and control technology, the illustration with the reset time and derivative time is commonly used. The translation between both structures is possible with the given formula:
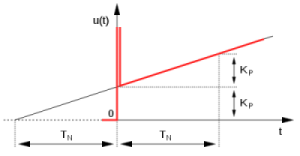
In image 1 you can see the ideal step response of a PID controller. From the image the meaning of each parameter becomes visible. Especially the meaning of the Tn as essential parameter for the I-term can be seen clearly. It also becomes obvious, why often Tn and not Ki is used as a parameter. However, in the real process it is easier to picture the parameter Tn as time.
Both controller structures are used here. The illustration with Tn and Tv is often used in Germany. The illustration with Ki and Kd is more common in English-speaking areas. There are three different PID controller implementations. In section Step response of PID controllers the behavior of the controllers can be compared very well.
2.1 What is a Reset time (Tn)?
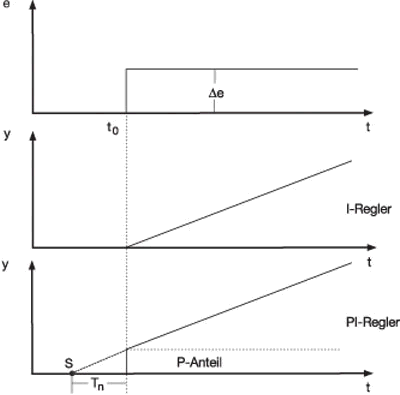
The I-term of the controller output signal has the effect of continuously altering the manipulating variable, until the actual value has reached the setpoint.
As long as the control deviation is present, the manipulating variable is integrated upwards or downwards. The longer the control deviation continues to be present in a controller, the larger the integral effect on the manipulating variable. The larger the control deviation and the smaller the reset time, the more pronounced (faster) the effect of the I-term.
The I-term ensures the stabilization of the control loop without permanent control deviation. The reset time measures how much the duration of the control derivation effects the control action. A larger reset time means that the I-term is less effective and vice versa. Within the specified time Tn (in sec.), the change in the manipulating variable that is produced by the P-term (xp or pb), is added once more. Accordingly, there is a fixed relationship between the P- and the I-term. A change in the P-term (xp) also means a changed time response, at a constant value for Tn.
(Jumo.de: What is meant by reset time (Tn)?)
2.2 What is derivative time (Tv)?
The intensity of the D-term (differential term) can be set via the derivative time. The D-term of a controller with PID or PD action reacts to the rate of change of the actual value.
When the setpoint is approached, the D-term acts as a brake, thereby preventing the control variable from overshooting the setpoint.
Basically, the D-term has the following effects:
As soon as the control variable changes, the D-term reacts against this change.
For a controller with an inverse operating sense (i.e. for heating) this would mean, for example:
- If the control variable decreases as a result of a disturbance in the process, the D-term forms a positive manipulating variable, which counteracts the reduction in a control variable.
- If the control variable increases as a result of a disturbance in the process, the D-term forms a negative manipulating variable, which counteracts the increase in a control variable.
- The damping action increases with the size of the setting for the derivative time (value in seconds).
(Jumo.de: What is meant by derivative time?)
3 PID Controller: Power-plant Controller (Implementation 1 – I1)
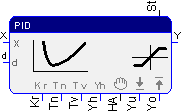
This controller was developed by the Center for Research and Technology (ZFT) in VEB EAW Berlin and used as a controller for a power plant.
Basically, the controller features a special implementation of the D-term.
- For intrusion of the D-term, an additional input (x) exists. Normally the input x is switched to the same signal as the d input. Experts can also specifically work with the D-term.
- The D-term is implemented with a relay as “actual” D-term (see Ideal and Actual PID Controller).
Further characteristics of the controller for power plants
- Hitchless hand/automatic switch
- Hitchless parameter change
This controller works after the following algorithm:
dYP=d-Wh
DYI=(d+Wh)*Ta/(2*Tn)
dYD=(X-Xh)*(10*exp(Ta/(Tv/10)))+YD*(exp(Ta/(Tv/10))-1)
YD=YD+dYD
Xh=X
Wh=ddY=(dYP+dYD+dYI)*Kr
Su=Su+dY;
Y=Su;
Please note: The shown algorithm does not correspond exactly the C source code of the controller, but a simplified illustration. Special characteristics regarding switching, windup etc. are not included.
Important note about a PID project in earlier versions
In the PID demo applications, the variable was connected to the input x. That is wrong. At the input x in the example, the negative deviation (same signal as on d) has to be connected.
4 Universal and Percent Controller (Implementation 2 and 3 – I2 and I3)
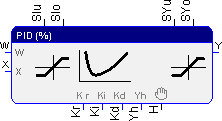
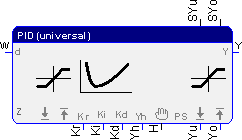
Library PID controllers (Float)(V3.0)
- PID-Controller (Percent)
- PID-Controller (Universal)
Both controllers (Percent and Universal) are based on the same mathematical basic logarithms.
esum = esum + e
y = Kp * e + Ki * Ta * esum + Kd * (e – ealt)/Ta
ealt = e
Please note: The shown algorithm does not correspond exactly the C source code of the controller, but a simplified illustration. Special characteristics regarding switching, windup etc. are not included.
5 Comparison of the PID Controller Step Response
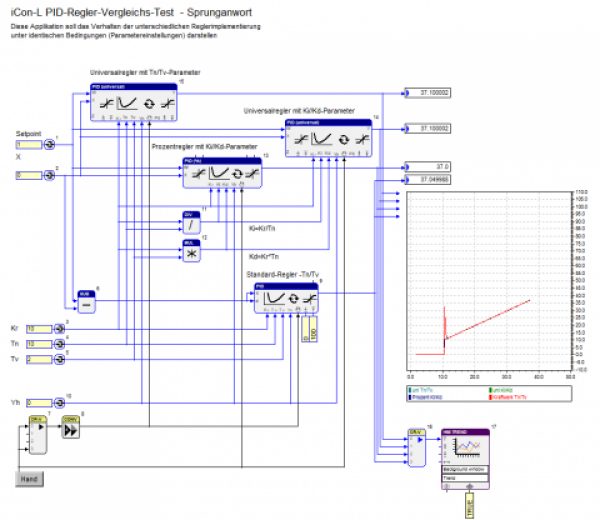
Image 6 shows an application program, which illustrates a comparison of the step response of the different controller implementations. For all controllers identical parameters are used (translation of the parameters in the different illustration forms Tn -> Ki; Tv-Kd).
Kr = 5
Tn = 10 (seconds)
Tv = 2
5.1 Test process
The program is downloaded on the controller with the constant values process variable W=0 and setpoint X=0
After 10 seconds the setpoint W is set on 1 (positive step signal).
5.2 Result
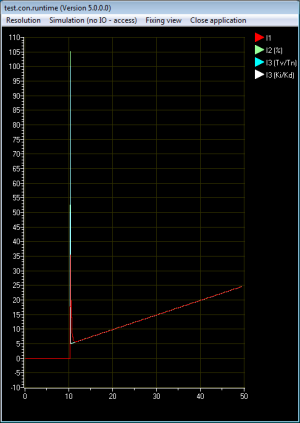
Like expected, the diagrams (image 6 and 7) show similar curves for all controllers. The controller for the power plant (I1 – red line) has a different behavior in the D-term. The controller does not show an ideal step, but falls into an e-function. The controller works like an actual PID controller.
Comparison with Image 1 – Ideal Answer
The controller shows the expected signal course.
- After the input signal step, the controller reacts with a very strong impulse.
- After that, the impulse decreases up to the Kr value.
- That value increases about the Kr value every 10 seconds (Tn)
5.3 Change of parameters during runtime
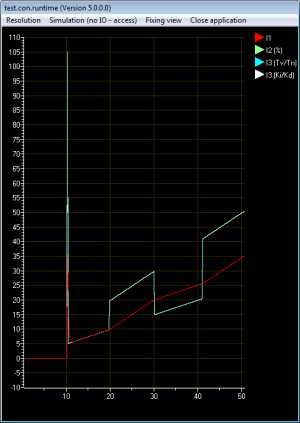
While the 3 implementations almost behave identically during the step, they do not remain that pattern during a parameter change in runtime. It becomes very clear when we look at the step response with a parameter change (Kr).
- Kr is changed from 5 to 10 after 20 seconds
- After 30 seconds Kr is set back to 5
- After approx. 40 seconds, Kr is set back to 10
In a second test, the parameter Tn is changed during runtime. The image is very similar to the signal course during the change of Kr.
- Tn is changed from 10 to 5 after 20 seconds.
- After 30 seconds, Tn is set back to 10.
- After 40 seconds, Tn is set back to 5.
A change of Tv did not make any difference, as the difference between W and X does not change.
5.3.1 Result
Power-plant Controller (I1) with hitchless parameter change
In image 8 we see the signal course of the step response. The red line shows the signal course of the power-plant controller (I1). You can see, that the parameter change (Kr) does not lead to a signal step at the output. The controller works in speed mode, so the new parameter only influences the difference between the actual value and the setpoint.
Controller (I2 and I3) with hitchless parameter change
It is different with the controllers I2 and I3. Both controllers behave identically, that is why there is only one curve for both controllers. The parameter change has a direct impact on the output signal and leads to a hitch in the system. It does not really matter if Kr or Tn is changed. Y directly depends on Ki and the integral of the difference. What is different from the implementation of the power-plant controller, is that the parameter Ki effects the whole integral of the I-term. That also explains the higher impact of the parameter change after a longer time. As Ki is also directly in Kr, the change also directly effects the I-behavior.
Ki = Kr/Tn
y = Kr * e + Ki * Ta * esum + Kd * (e – ealt)/Ta
Changing Tv does not have any effects, as the difference does not change during a step signal.
5.3.2 Why these different implementations?
Although the hitchless parameter change can lead to problems in actual systems, this implementation corresponds to the expectations of the user. If a parameter doubles, the user expects a direct and heavy response of the controller, as they are thinking of the simplified mathematical formula.
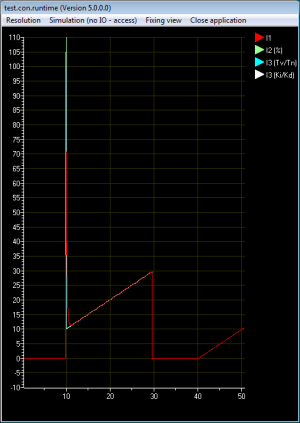
Test Process
- After 10 seconds a step signal (1) is fed to the open PID controller.
- After 30 seconds the controller is switched by hand (Yh=0)
- After 40 seconds the controller is switched back to automatic.
Result – Hitchless Hand/Automatic Switch
All three implementations behave identically with simple hand/automatic switch (see image 9).
- When changing the signal Yh=0 by hand, the signal is fed to output Y.
- At the same time, the internal sum of the controller is set to the Yh value minus the value from the P-term.
- When changing to automatic operation, the controller starts from the preset Yh value at the output.
- During automatic operation, initially the I-term operates, as the P-term is subtracted out from the internal sum.
6 The Closed Loop Control System
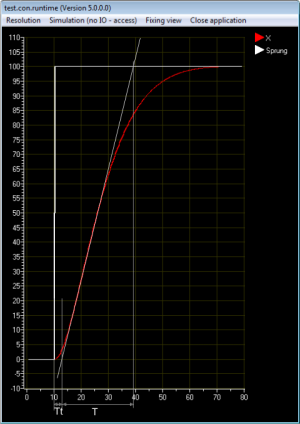
Now the behavior of each controller implementation is observed in a closed loop. To define simple parameters, the Ziegler-Nichols methods is used. To get familiar with that method, just have a look at Wikipedia: Ziegler-Nichols method.
Using the Ziegler-Nichols method should not be seen as a recommendation, as it is not really the ideal method. The method will only serve to illustrate the behavior of the controller.
6.1 Step Response of the PT2 Line
In image 10 you can see the step response of the PT2 line (PT2 function block – TC=10; A=0.9). The curve shape is evaluated according to the chosen method.
Results
Tt = 3 Sec.
T = 26 Sec.
6.2 Command Response as PI Controller
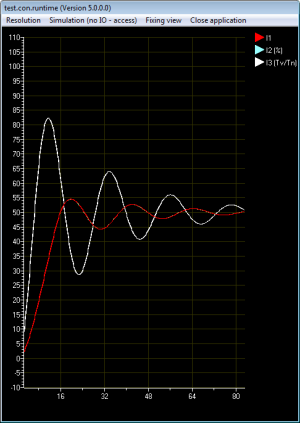
The parameters for the PI controller are determined and assigned according to the Ziegler-Nichols method.
Kr = 0.9/K * T/Tt = 7.8
Tn = 3.33 * Tt = 9.99
Image 11 shows the behavior of the controller.
- The universal controllers (I3) (Image 11 – white line) work without a limitation of the output. Normally the output is limited according to the actual possibilities of the step response.
- The power-plant controller (I1) and the percent controller (image 11: I1=red line and I2=green line) is limited at the output to 0-100%, so it cannot use its full potential.
All 3 implementations (I1 to I3) would generally behave identically, if I3 would be limited to 0-100, too. The controllers overshoot widely, as according to Ziegler-Nichols the adjustment procedure is used for a disturbance behavior and not for a command response.
6.3 Command Response as PID Controller
According to the Ziegler-Nichols method, the parameters for the PID controllers will be identified and assigned.
Kr = 1.2/K * T/Tt = 10.3
Tn = 2 * Tt = 6
Tv = 0.5 * Tt = 1.5
Image 12 shows the behavior of the controllers.
- The universal controllers (I3) (Image 11 – white line) work without limitation of the output. Normally the output is limited according to the actual possibilities of the step response.
- The power-plant controller (I1) and the percent controller (I2) (image 12: I1=red line, I2=green line) are limited to 0-100% at the output, therefore they cannot use their full potential.
The PID controller does not overshoot as much as the PI controller, as the D-term is attenuating, even though Kr was raised and the controller works faster in general.
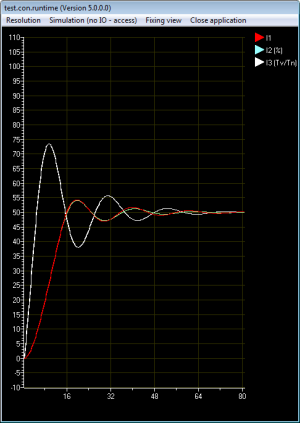
6.4 Setting Rules of Chien, Hrones and Reswick
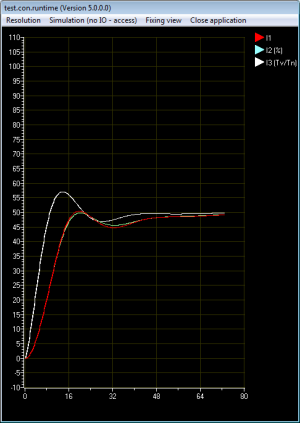
A better command response can be aimed, when applying the setting rules of Chien, Hrones and Reswick.
Kr = 5.2
Tn = 26
Tv = 1.5
| Controller | Acyclic control mode | Aperiodischer Regelverlauf | Control mode with 20 % overshoot | Control mode with 20 % overshoot | |
|---|---|---|---|---|---|
| Störung | Führung | Störung | Führung | ||
| P | Kr | 0.3*(T/Tt*K)) | 0.3*(T/Tt*K)) | 0.7*(T/Tt*K)) | 0.7*(T/Tt*K)) |
| P | Kr | 0.6*(T/Tt*K)) | 0.35*(T/Tt*K)) | 0.7*(T/Tt*K)) | 0.6*(T/Tt*K)) |
| PI | Tn | 4*Tt | 1.2*T | 2.3*Tt | 1*T |
| PI | Kr | 0.95*(T/(Tt*K)) | 0.6*(T/(Tt*K)) | 1.2*(T/(Tt*K)) | 0.95*(T/(Tt*K)) |
| PID | Tn | 2.4Tt | 1*T | 2*Tt | 1.35*T |
| PID | Tv | 0.42*Tt | 0.5*Tt | 0.42*Tt | 0.47*Tt |
6.5 Comparison of the Controller Disturbance Behavior
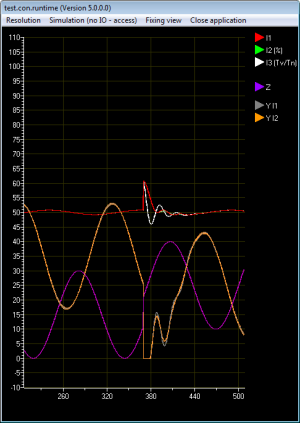
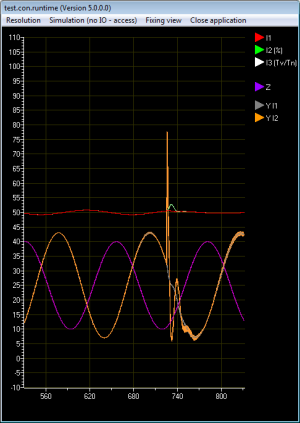
Image 14 shows the disturbance behavior of the controllers during a low-frequency sine-shaped disturbance. The purple line shows the disturbance signal, which is directly assigned to the control variable. The overlaying red, white and green line show the controlled control variable. The orange and overlaid grey line show the control input of the controllers I2 and I1. The massive overshoot of the control variable comes from the disturbance signal of 25%. All three controllers adjust to the disturbance step very well.
Image 15 shows the behavior of the controllers during a parameter change. While the universal controller and the percent controller react on parameter changes with a massive overshoot, a parameter change at a power-plant controller is not noticeable.
7 Ideal and Actual PID Controller
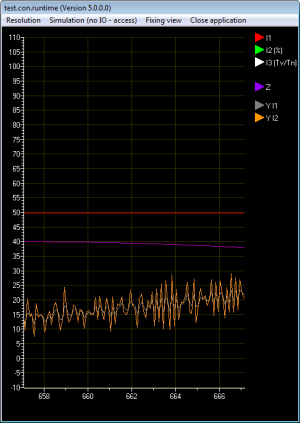
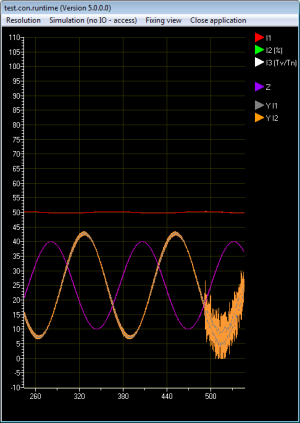
At an ideal controller, the D-term has no delay. Such behavior, however, is not possible in practical experience. It is also not desired, because the control device might already tend to overdriving at high-frequency disturbances of small amplitudes, which can be overlaid by the control variable. The implementations of the universal controller (I3) and the percent controller (I2) are much closer to the ideal behavior of a controller, than the power-plant controller, as these implementations do not have a delay of the D-term in their algorithm. Of course these controllers react delayed in combination with the control variable. Images 16 and 17 show that the universal controller (I3) and the percent controller (I2) react relatively “nervously” on high-frequency disturbances. However, the power-plant controller reacts more softly on high-frequency disturbances.

