XY Writer
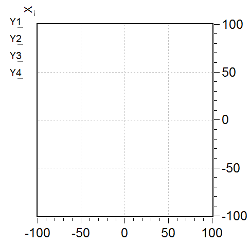
The XY-writer can be used to display any kind of graph of the connected numeric signals.
It is possible to connect up to four signals, which creates four different chart lines. The value curves represent the relations of the pairs from the input X and one of the Y inputs.
The buffer size has an essential influence on the indication of the signal courses. Like the other parameters it can be adjusted in the parameter dialog. During online observation the function block reads the signal values cyclically with the configured refresh rate and stores changed values in a temporary ring buffer. The current content of this ring buffer is represented in the display field of the block. Old values vanish after a particular time. They have been replaced by newer ones. With large ring buffers one can look back further to the past. On the other hand the display field is limited and the signal course can be recognized considerably better when old values are deleted cyclically. When leaving the online observation the ring buffer is deleted. When the online observation is started again, the old data is not available anymore.
Parameters
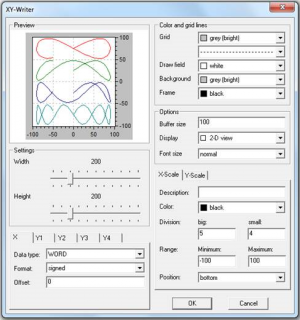
The parameter dialog can be used to change several preferences.
The size of the function block can be defined. The data type of all input signals and the display color of the four different Y values can be selected and a name can be given. The colors of the function block components (drawing area, background, and frame) and the gridlines can be selected. The buffer size defines the number of elements internally held.
The properties of the X- and the Y-scale can be given (name, color, major and minor tics, minimum, maximum, and position). Finally the general display mode and the font size for the labels can be selected.
Signals
| Name | I/O | Type(s) | Function |
|---|---|---|---|
| X | I | BIT, BYTE, FLOAT, LONG, WORD | X-value |
| Y1 | I | BIT, BYTE, FLOAT, LONG, WORD | Y-value |
| ... | |||
| Y4 | I | BIT, BYTE, FLOAT, LONG, WORD | Y-value |
Comment
This function block has no corresponding target code. During online observation the values are read and represented cyclically.
Like already mentioned, the sample rate is limited by the refresh rate. This value can fluctuate depending on the performance and the work load of the PC. Therefore fast changing signals can only be covered inadequately with the visualization blocks. The archive function block (see archive library) should be used for the real time recording of signals.