User interface
1 The integrated development environment (IDE)
The software is not programmed using a textual programming language, but a graphical editor. By drawing block diagrams, a user-specific application is created. Different types of block diagrams can be drawn. Most common are continuous function charts and flow charts or page flow diagrams. You can read more about graphical programming in general in the section theoretical background.
In the following video you can have a look at the user interface.
If the video does not work, you can click here.
Content
- Overview user interface (configuration level, system context diagram, program block, macro block, function block, visualization block, control elements, standard macro elements, inputs and outputs of the macro blocks).
- Configuration level, levels in general, program level (03:10)
- Macro blocks (04:54)
- Creating a macro block (example) (05:23)
2 Edit mode
Edit mode is the default state of the system. In this state the main editing of the project takes place. By loading and deleting libraries, defining and deleting structure blocks, implementing, deleting and connecting blocks, the structure of a project is set.
Commands can be given over the menu, the toolbar and using shortcuts.
2 Block diagram editor (worksheet)
In the block diagram editor, the block diagram is drawn using the drag&drop function. Predefined function blocks are dragged from a library and dropped (positioned) on the worksheet freely. Following, the signal lines between inputs and outputs of the blocks are drawn.
In the project tree, all macro and program blocks of the project are listed. Macro and program blocks can be created and implemented on the worksheet by the drag&drop function.
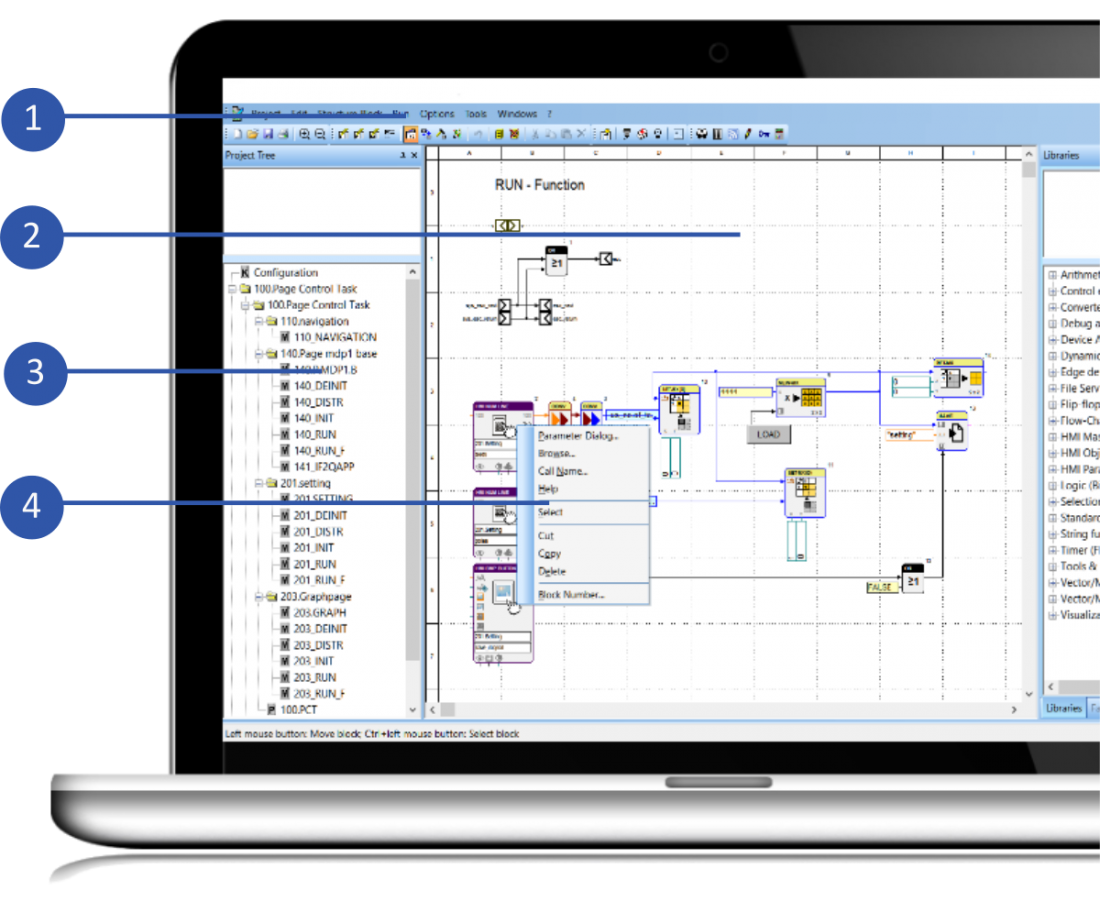
Context menus are called in the worksheet or the project or library tree using the right mouse button. The containing commands refer to the object below the cursor. Using context menus makes the operation easier and quicker. Some commands, like f. e. deleting connections, can only be called in the context menu. Depending on the system state and selected object, different context menus exist.
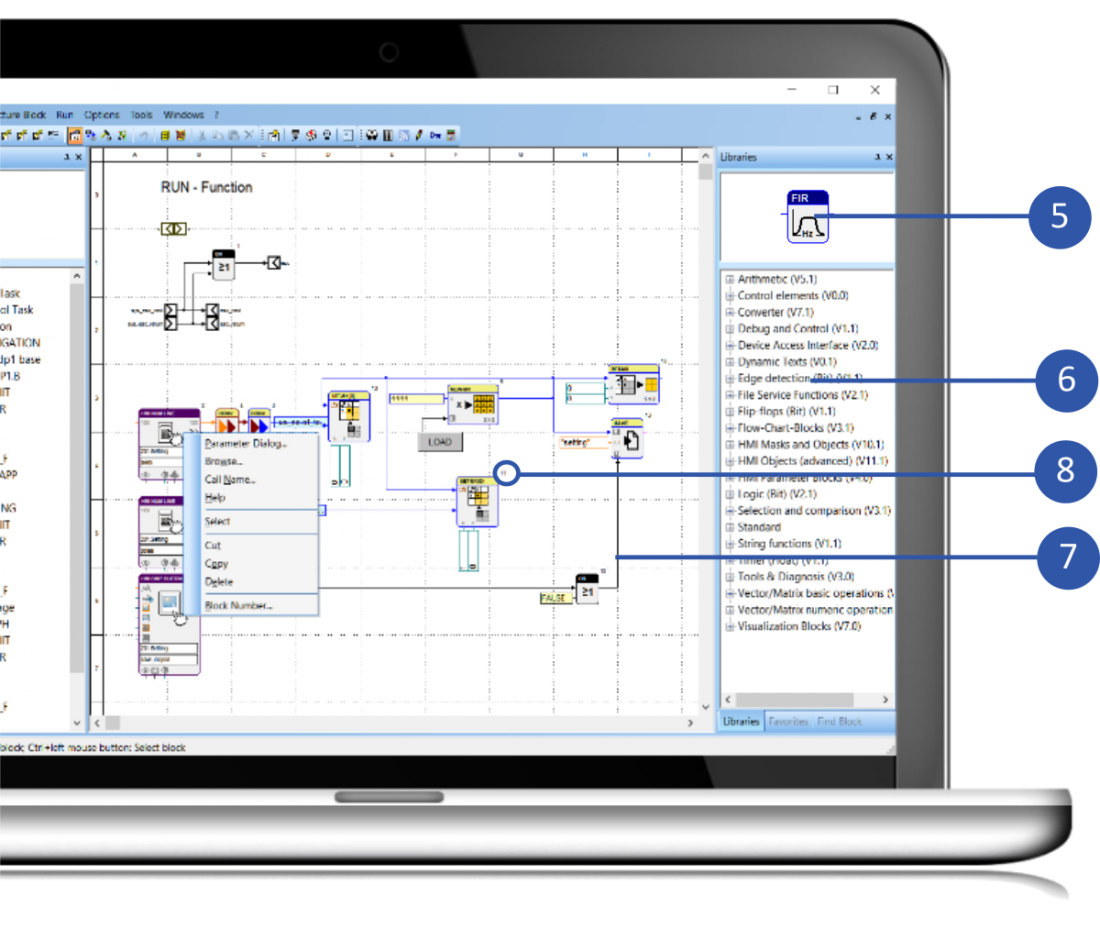
5 Block
The term blocks, includes structure and function blocks. Structure blocks are used for hierarchic structure. Function blocks, however, are used for parametrization, calling a target function or visualize values during online observation. Blocks are defined in the project or in loaded libraries.
The function block library contains all available function blocks for programming the software. There are two styles of function block libraries. One is the standard function block library, which contains the loaded function blocks in a flat and library-oriented view. The second view is the favorites function block library. Here you can hierarchically sort your function blocks according to your needs. Furthermore blocks are selected in this library and dragged on the worksheet using the drag&drop function.
Connections serve to specify the data flow or the control flow between the blocks. Data flow-oriented programming facilitates the connection of one output with one or more inputs. In case of several inputs, branches occur that are marked by nodes on the connections. On the other hand, control flow programming facilitates the connection of several outputs with one input, e.g. in case of flow charts. Such branches create subconnections which can be edited separately.
The number on the right upper corner of the block during edit mode defines, amongst others, the execution order in the target system. Blocks with a lower number are called before blocks with a higher number. The execution order can have main influence on the function of the program.
3 Online mode
After successfully loading an application program, the system will automatically change to online observation. During online observation, visualization blocks cyclically read the connected signals and display the values in the block symbol. Some blocks with a target function show their internal switching state. In the online help of the blocks, the visualization functions are described.
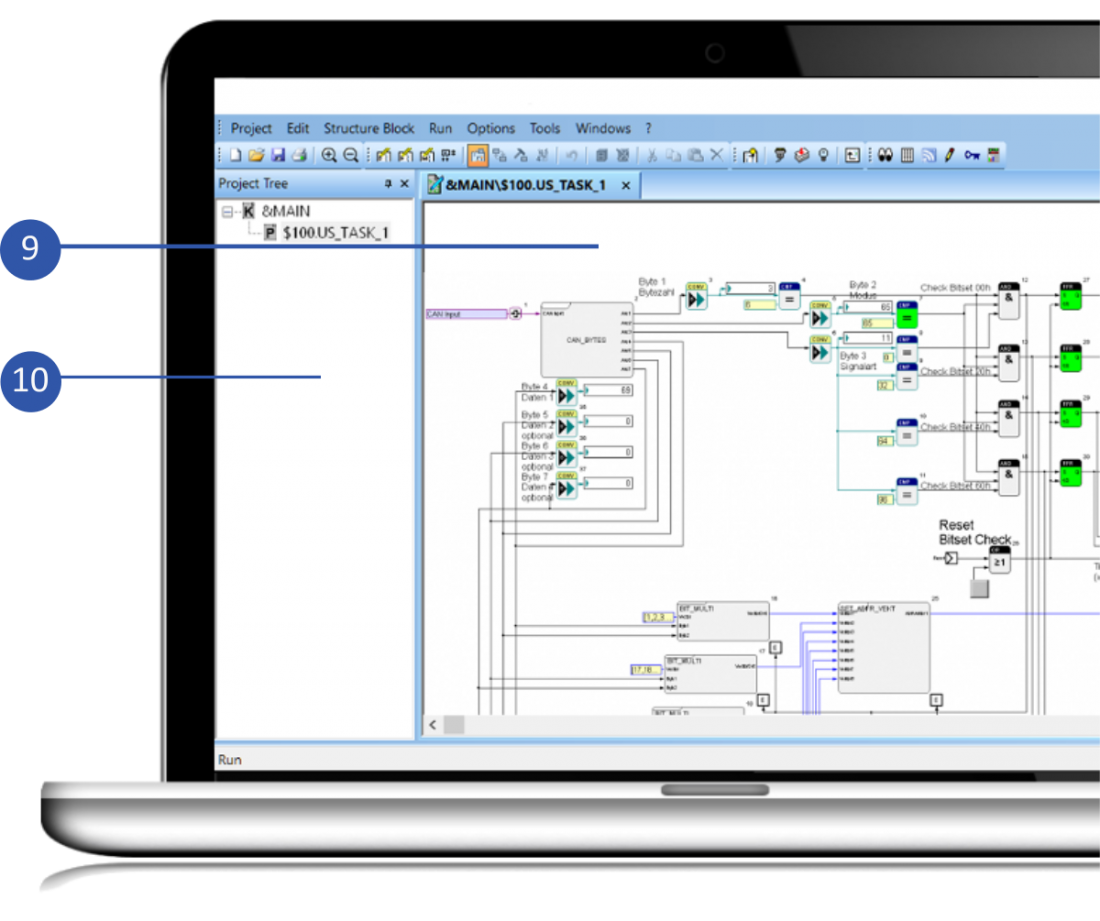
9 Block diagram visualization
In the system state run mode, the worksheet becomes a visualization interface for the drawn block diagram. In this state you cannot change the block diagram. Now you can navigate in the project by a simple mouse click on a macro or program block in the project and, if necessary, implement individual parameters for the single instances of a block. Subsequently you can load the program into the controller. After loading, the IDE automatically switches into online mode. Now you can observe the status and process values online in the program.
10 Project tree - navigation
In run mode, the project library changes into a project tree. While during drawing, which is in edit mode, only block types (classes) of macro and program block only occur once, the real hierarchies are represented in run mode. So if one macro block is used various times, you can see instances of this block in the project tree. You can navigate in the real project hierarchies over the project tree.