System diagnostic
1 Overview
iSysdiag is a frame of useful tools for develop and online observation during development and commissioning.
This features are based on an activated service interface within the target system.
iSysdiag includes basically tools
- for runtime measurement
- for stress measurement
- for data monitoring and
- read system trace messages
within the connected target system.
2 List of tools
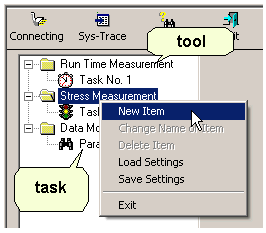
The list of tools (tree) shows the available tools and configured tasks. The configuration of the tasks is changeable by use of a context menu.
The following possibilities exist:
- "New Item" (available on a tool item)
- A new item can be added. The number of items of "Run Time Measurement" and "Stress Measurement" are limited (maximum 15).
- "Change Name of Item" (available on a task item)
- This is useful for items of the data monitor.
- "Delete Item" (available on a task item)
- "Load Settings" (available on a tool item and task item)
- Before saved settings can be loaded. The current settings are overwritten without query.
- "Save Settings" (available on a tool item and task item)
- The current settings are saved.
- "Exit" (available on a tool item and task item)
- The current settings should be saved before. The system diagnostic can not quit if a process is running.
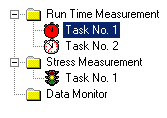
Running processes are highlighted by a red icon.
3 Window - connection
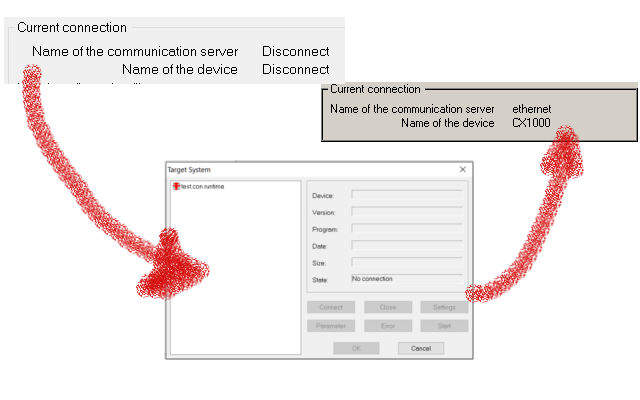
In this window, the current connection data, which includes the name of the communication server and the name of the device, is shown.
The connection can be activated by clicking on the ![]() button in the toolbar.
button in the toolbar.
4 Window - messages

Within this window communication messages will shown. These messages are helpful to find the cause of possible problems.
5 Toolbar
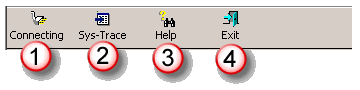
1 – establish a connection
2 - reading trace messages from target system
3 – help to the addon
4 – exit addon
5.1 Connection
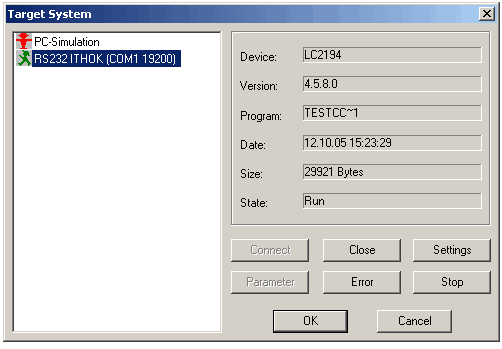
To read out information a target system must be connected.
The dialog represented below is shown after pressing the "connecting" item of the toolbar.
For helpful information to establish a connection press "F1" when this dialog is shown.
An established connection is represented in the window "Current connection".
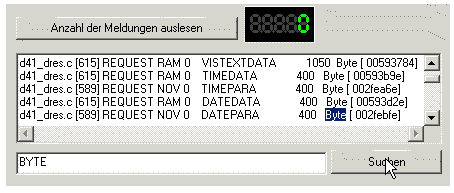
5.2 Read out trace messages
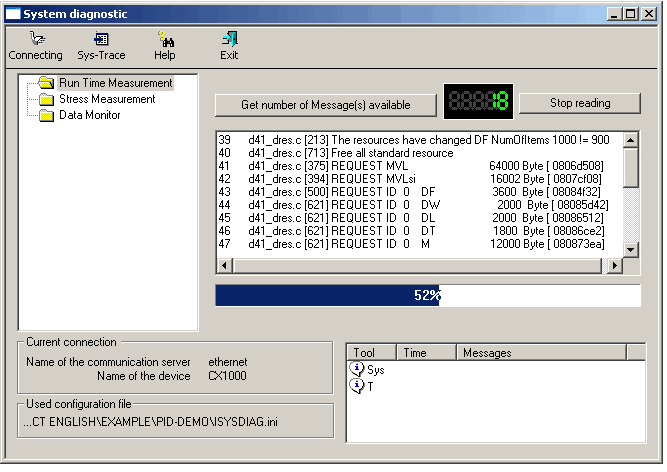
If the trace is activated in the connected target system available messages can readout.
By use of the button![]() Readout trace messages the number of available messages will readout.
Readout trace messages the number of available messages will readout.
If messages are available these can readout by use of the button ![]() .Readout trace messages
.Readout trace messages
Stop this process by use of the button ![]()
Read messages are not provided any more.
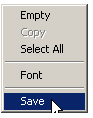
Saving messages is possible by use of the context menu item "Save".
Searching within the trace messages will done by input the search string. After this press the button "Find". The search is not case sensitive.
6 Tools
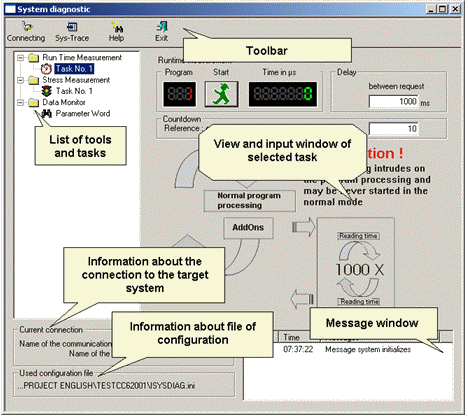
Within the view and input window (see picture introduction) the interaction with the selected tool is possible.
The following standard tools exist:
6.1 Runtime measurement
This addon can be used for run time measurement of each task within the target system.
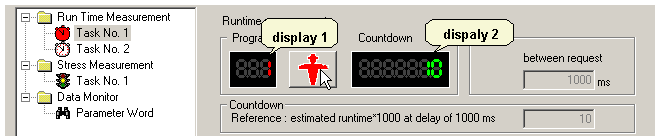
To be able to take an exact measurement, the program is passed through 1000 times.
Be aware that while measuring, the main process is being stopped meanwhile. For that reason the measurement should only be processed while in run mode. Only the run time of a single task in the iCon-L target system is measured. Select the program in the list of tools. Display 1 shows the selected program number.
With the button ![]() the measurement will start. In no connection was established yet, this has to be done now.
the measurement will start. In no connection was established yet, this has to be done now.
With the button ![]() Run time measurement a running measurement will stop.
Run time measurement a running measurement will stop.
With start of measurement a requirement on the target system is sent which interrupts the normal process and initialize the measurement. The result of the measurement will queried after time that is predefined in the field "Delay". This query will execute until a result exists. The values for the delay lie between 1000 and 10000 ms.
The dynamical behavior of the run time measurement is dependent from the architecture of the operating system on the corresponding device.
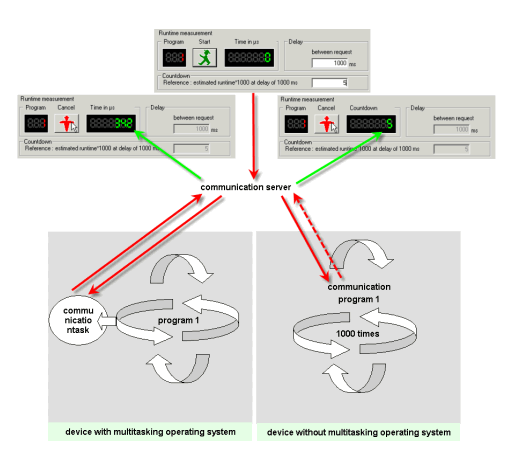
If a real multitasking system is available and if the communication has a own task can observed directly. In this case the device is able to answer during measurement. If this is so the passes (x from 1000) will shown in display 2.
If the program processing and the communication runs in one task the normal processing is stopped by the query. The program will passed through 1000 times. The device answers after this. If the time of measurement is longer then the defined delay the count down will reduced.
The program has an expected run time of 9 ms. The value for the count down is defined with 5 and the delay is defined with 1000 ms. If a query is sent to the device (after 1000 ms) a result is not available (1000 runs x 9 ms -> 9000 ms). In this case after 5 requests the count down starts again.
After finished measurement the runtime of the selected task for one cycle is shown in display 2.
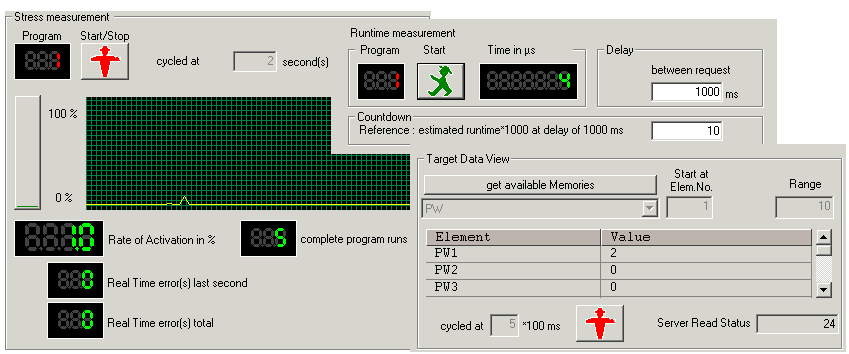
6.2 Stress measurement
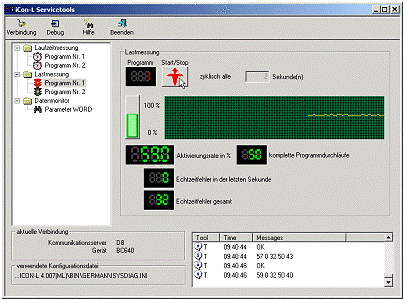
This part of iSysdiag gives an overview about
- how often the selected task was activated within a second and
- how often the program was passed through completely
Additional information about the real time errors in the last second and cumulative will be displayed.
The information
- complete through outs
- adjusted cycle time and
- the measuring time period
the reliability of the program runs can be stated.
The following example will make this more clear:
- adjusted cycle time: 20 ms
- measuring period: 1 s
If the task runs without problems 50 through outs of the task have to be absolved. (1000 ms/20 ms )
If less than 50 runs will be displayed then real time errors are also displayed.
This errors demonstrate that the task was activated but aborted before the complete processing.
The cause of this error can be that the run time of a task is longer then the adjusted cycle time. To check this the run time measurement can be used.
It is also possible that a task with a higher priority has aborted the actual task.
6.3 Data monitor
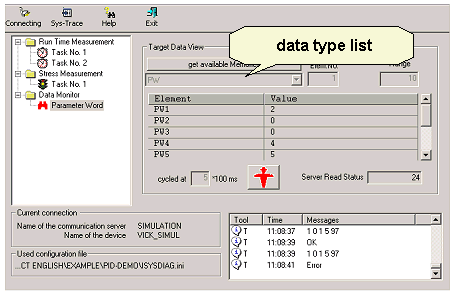
The list of tasks for data monitoring can be extended. (see List of tools)
For each point of interest (resource referenced by name) a view can be defined. If a connection was established the list of resources which are defined in the device is available. Before start of reading the values the first element and the number of elements have to be defined.
Too much of data points can overload the communication so that the request will be aborted.
The update rate is a multiple one of 100 ms.
The readout of the values starts and stops by use of the buttons ![]() and
and ![]() .
.